![Gush Dan Neighborhoods: Average COVID-19 associated symptoms region map. City municipal regions with at least 30 responders and neighborhoods with at least 10 responders are shown. Each region is colored by a category defined by the average symptoms ratio, calculated by averaging the reported symptoms rate by responders in that city or neighborhood. Green - low symptoms rate, red - high symptoms rate. Image: Weizmann Institute](https://nocamels.com/wp-content/uploads/2020/03/Gush-Dan_Neighborhoods_0-350x206.png)
Israeli Scientists Develop Predictive Framework To Detect Coronavirus Spread Zones
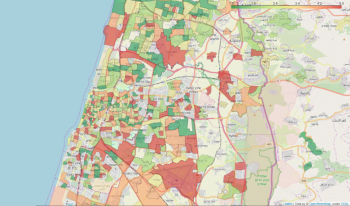
Israeli scientists have developed a framework for monitoring, identifying, and predicting the novel coronavirus’s spreading zones in the country. The method, developed jointly with researchers from The Weizmann Institute, The Hebrew University of Jerusalem and Clalit Health Services – and in coordination with the Israeli Health Ministry – is built on population-wide surveys, data analysis, […]
March 23, 2020