When members of the Hamas terrorist organization stormed into southern Israel from Gaza on October 7, murdering 1,200 people and wounding thousands more, the enormity of the attack was hard for many to comprehend.
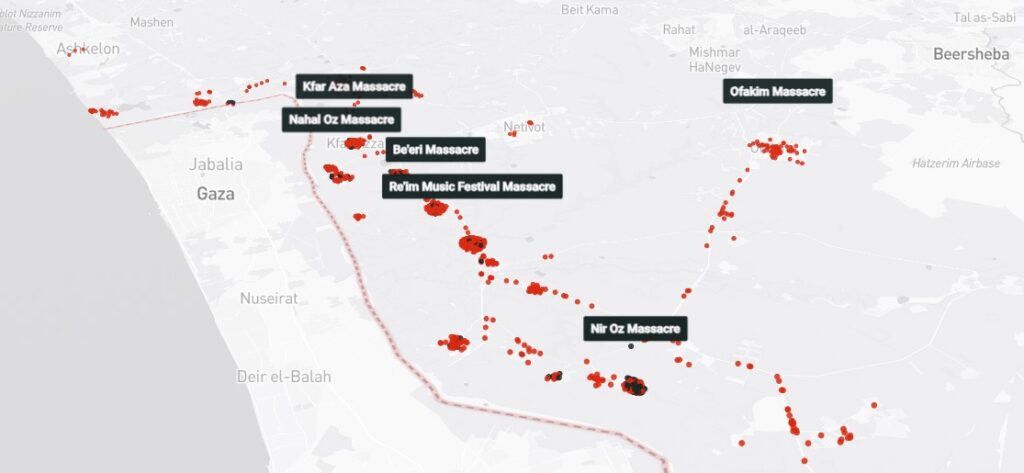
To preserve the history of the massacres and to help understand what really happened on that day, a group of Israeli tech experts have created an interactive map, detailing the location and events of each attack.

The Palestinian terrorists rampaged through the communities close to the Gaza border, raping and slaughtering people in their homes, on the streets and even at a music festival for peace.
The bodies of the victims were mutilated and burned often beyond recognition, and at least 240 men, women and children were abducted by the terrorists and dragged by force into Gaza.
It took days for the Israeli security forces to completely root out the thousands of terrorists that made their way into Israel through the breached border fence. Some of the victims’ bodies were so badly desecrated that they have still not been identified and perhaps never will.
Yet the massacres quickly became overshadowed in the eyes of the world by the war that the Israeli government immediately declared on Hamas, as well as the widespread protests against Israel that erupted even on that same, terrible day. Some protesters have even disputed the facts of the hideous attacks.
“Our mission stemmed from the realization that people struggle to access and comprehend information about significant events,” say the creators of the map, who wish to remain anonymous.
“Therefore, we decided to initiate a reliable and comprehensive, well-sourced tool, countering the prevailing culture of doubt surrounding current events,” the group tells NoCamels.

This led to the creation of the map, which the group says helps to bridge a gap between “understanding the October 7 events and functioning as a familiar pattern that people know how to interact with.”
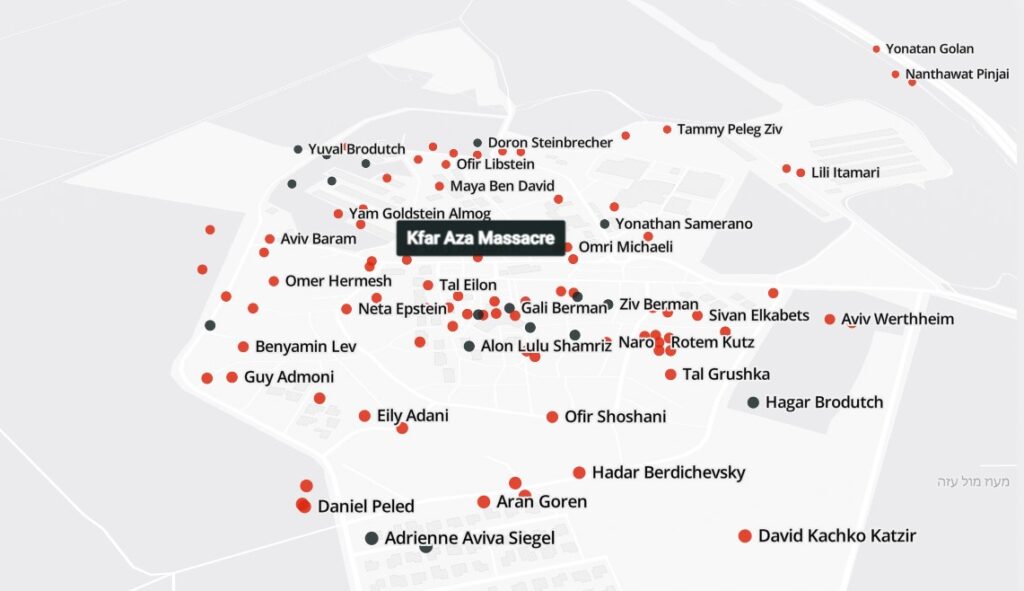
The first thing visitors to the website see is an overview of the area that was attacked, with the name of each community visible, red dots to signify each of the victims whose bodies have so far been identified and black dots to mark those who are being held hostage in Gaza.
There is also accompanying text giving a brief overview of the events of the day, along with the numbers of dead, wounded, missing and abducted.
“All the information about the victims is already out there,” the group says, “we simply gather it in a way that makes it more accessible and requires minimum effort to consume.”
Sign up for our free weekly newsletter
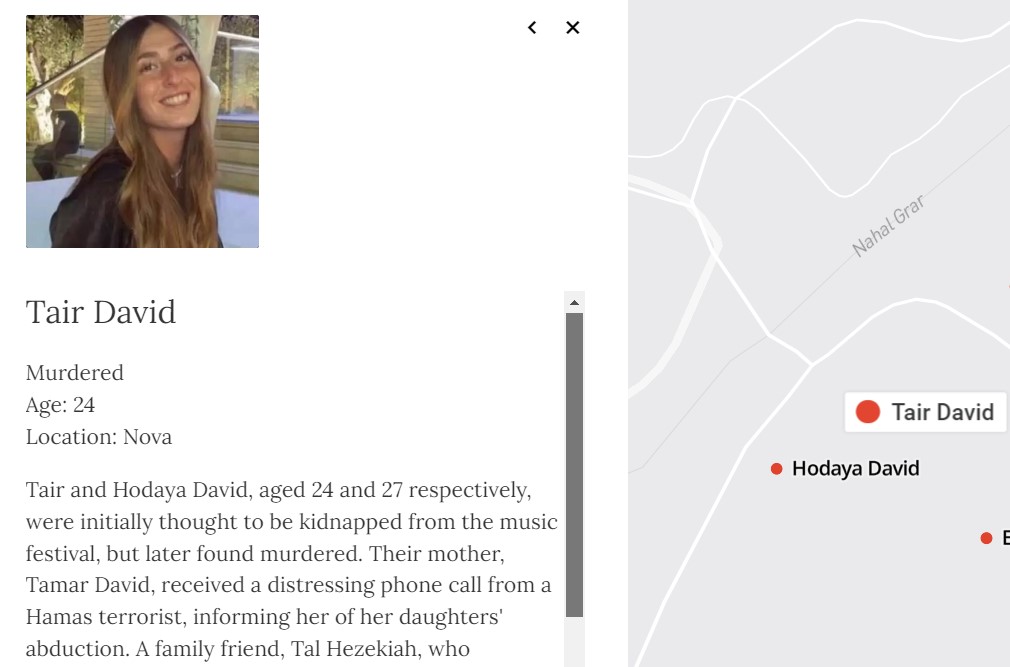
SubscribeClicking on any location that was attacked enters into a more detailed display, which includes the names of the dead and the missing, and recounts what happened there.
Each name is clickable and opens up a page for that person, including a photo, their age and their fate.

The map builders describe themselves as a “private, volunteer-based civilian group dedicated to preserving the memories of the victims and fostering a deeper understanding of the events.”
The team comprises individuals from diverse backgrounds, including engineering, UX design, scientific research and big data, which allowed them to apply simple tech solutions to complex issues.
They alone are the sole collaborators and contributors to the project, the group says.
The information contained within the map is all publicly available data drawn from trusted news outlets, social media insights and official memorials to the victims, the group explains, adding that it has taken further steps to ensure its accuracy and reliability.
“Our commitment is to offer viewers access to the most credible and up-to-date information possible,” it says. “We conduct thorough validation and assurance of information safety, and cross-verify our findings.”

The map has attracted broad interest, drawing visitors to the website from around the world and widely being shared on multiple social media platforms.
There are other initiatives that document the attack, honor the victims and share witness statements, but the group says its project is the only one that geo-visualizes the massacres.
“The differentiator in Oct7map is its simplicity and the small amount of time and cognitive effort it takes to understand the extent, intent, and nature of the October 7 events.”
Related posts

Editors’ & Readers’ Choice: 10 Favorite NoCamels Articles

Forward Facing: What Does The Future Hold For Israeli High-Tech?

Impact Innovation: Israeli Startups That Could Shape Our Future


Facebook comments